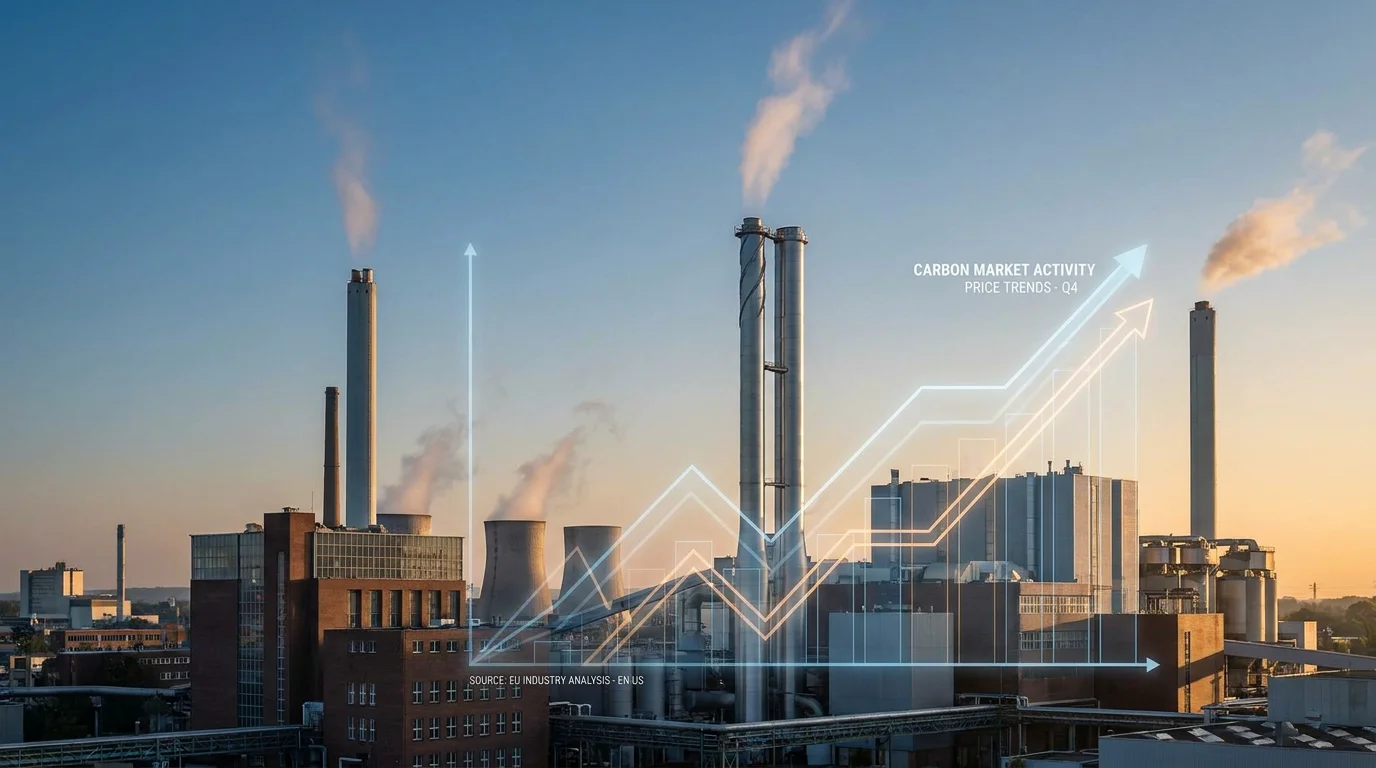

Carbon pricing mobilized over $107 billion for public budgets in 2025, according to the World Bank, and emissions trading systems generated the vast majority of that total. With three new national systems launching in 2026 and allowance prices trending upward, the stakes for compliance entities and financial participants have never been higher.
Whether you are an industrial operator preparing for regulatory obligations or a financial institution seeking alpha in carbon markets, understanding how these systems function is essential. This article covers the mechanics of cap and trade, the regulatory landscape shaping today's EU Allowance (EUA) market, the expansion happening worldwide, and the practical strategies that professionals use to navigate an increasingly complex trading environment.
What Is an Emissions Trading System and How Does It Work?
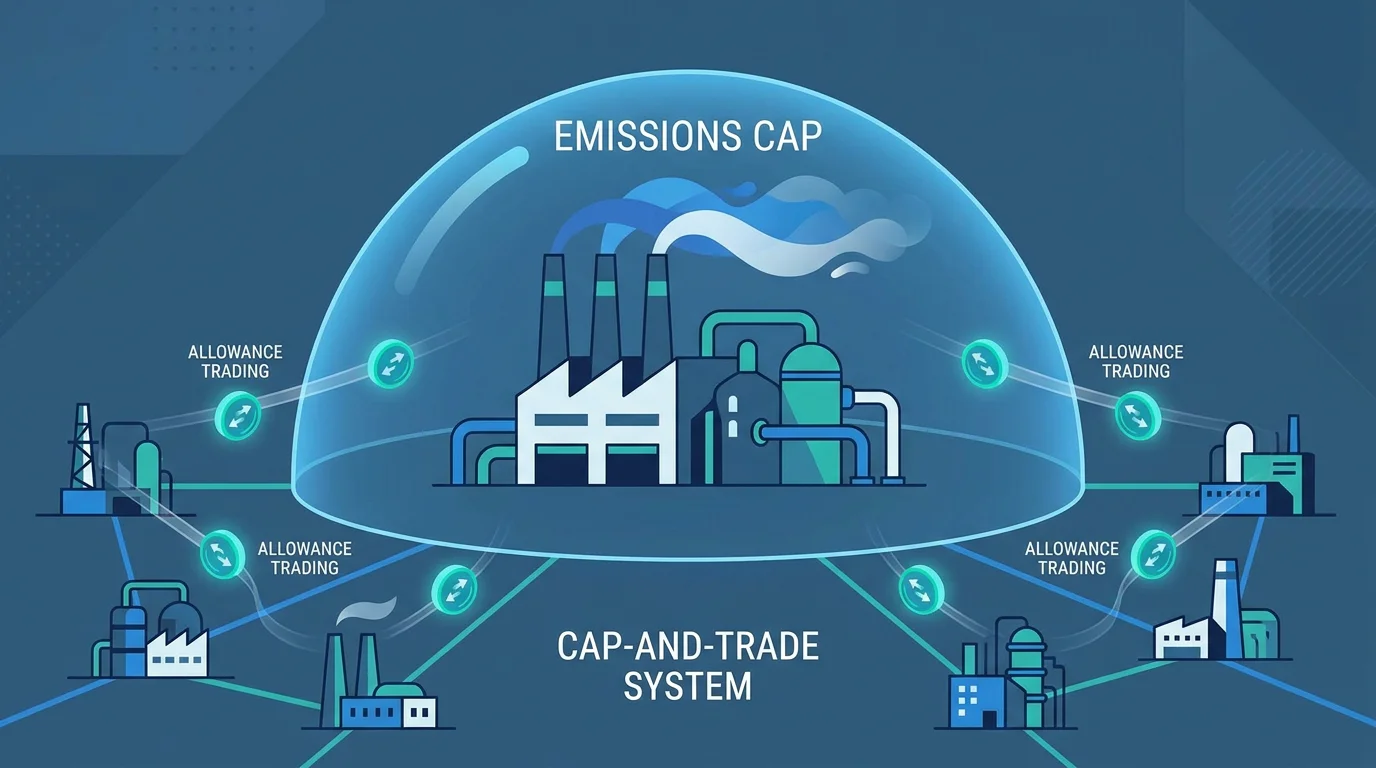
An emissions trading system (ETS), often called a cap-and-trade scheme, is a market-based policy tool that sets an upper limit on the total greenhouse gases a defined group of emitters may release. A regulator distributes or auctions a finite number of emission allowances, each representing the right to emit one tonne of CO₂ equivalent. At the end of each compliance period, every covered entity must surrender allowances equal to its verified emissions.
The elegance of the mechanism lies in what happens next. Coverage under these systems has more than doubled in recent years, reaching approximately 22% of global emissions from ETS alone. Entities that reduce emissions below their allocation can sell surplus allowances on the open market. Those facing higher abatement costs can purchase allowances instead. This creates a financial incentive to decarbonize where it is cheapest, driving economy-wide efficiency.
Two features distinguish an ETS from a simple carbon tax. First, the cap provides environmental certainty: total emissions will not exceed the defined limit. Second, the market-set price adjusts dynamically to economic conditions, innovation, and energy transitions, rather than remaining fixed by statute.
The EU Emissions Trading System: A Global Benchmark
Launched in 2005, the EU Emissions Trading System was the world's first international cap-and-trade program for greenhouse gases. It is now in its fourth phase (2021 to 2030) and remains the largest compliance carbon market on the planet.
The EU ETS became the world's first carbon market in 2005 and is now in its fourth phase (2021 to 2030). It covers approximately 9,000 power plants and industrial installations across the 27 EU member states plus Iceland, Liechtenstein, and Norway. The system addresses around 36% of the EU's total greenhouse gas emissions, and its scope continues to expand into maritime transport and aviation.
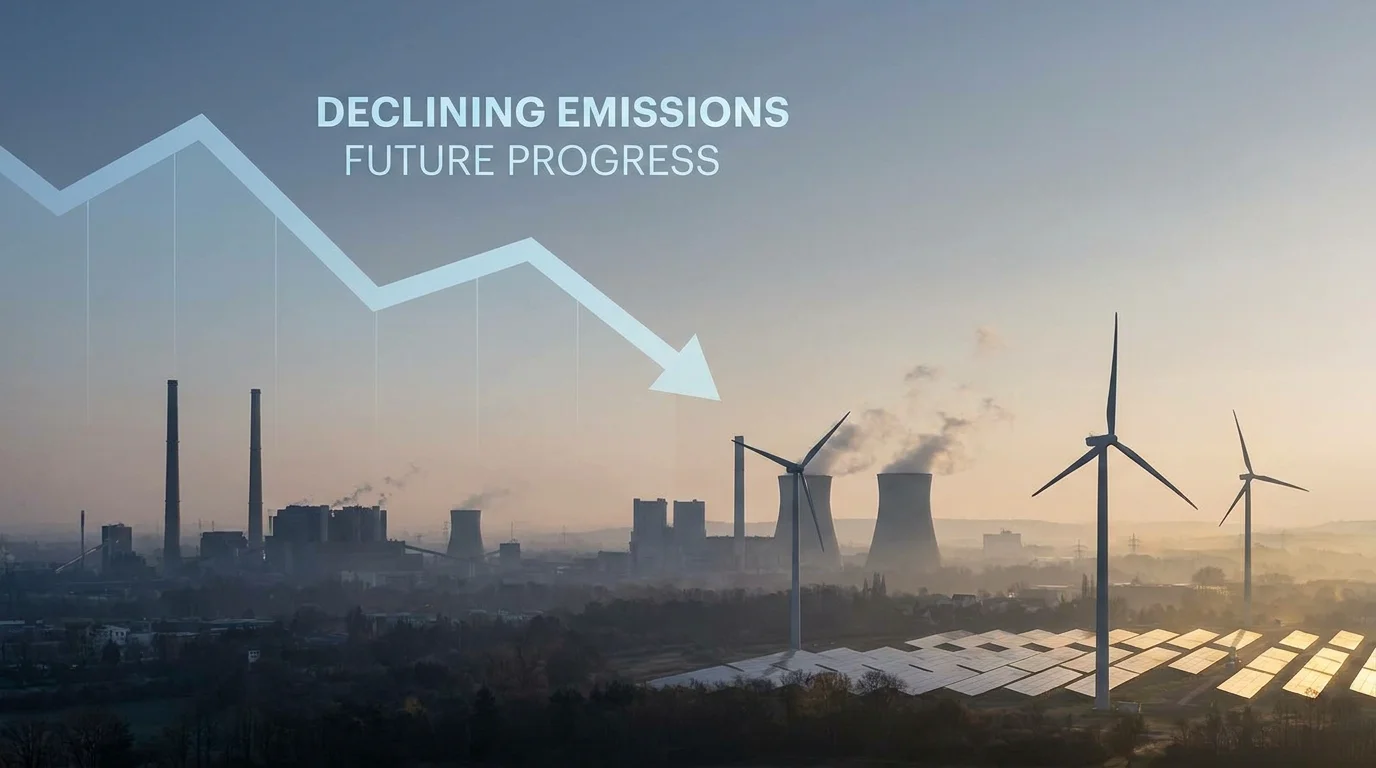
The 2023 reform package significantly tightened the system. The new 2030 target calls for a 62% reduction in ETS emissions compared to 2005 levels. The linear reduction factor, which determines how fast the cap shrinks each year, was raised to 4.3% for 2024 through 2027 and will increase to 4.4% from 2028 onward. At this trajectory, the emissions cap would reach zero by 2039.
Shipping emissions are now fully covered under the ETS. As of 2026, shipping companies must surrender allowances for 100% of their verified emissions from intra-EU maritime transport. The phase-out of free allocation for sectors falling under the Carbon Border Adjustment Mechanism (CBAM) has also begun, with full phase-out scheduled by 2034.
EU Allowance Prices: Where the Market Stands
Price movements in the EU ETS directly affect compliance costs, trading strategies, and investment decisions. EU Carbon Permits increased to 77.46 EUR, the highest since April 2026, with a gain of 3.53% over the past four weeks. This marks a continuation of the recovery trend that began after a downturn in 2024.
Looking at the broader trajectory, the average EU ETS carbon price was 84.4 euros per metric ton of CO₂ during the period 2022 to 2025, but is projected to rise to almost 100 euros per metric ton of CO₂ during the period 2026 to 2030, according to a survey of International Emissions Trading Association members reported by Statista. This upward trajectory reflects tightening supply as the linear reduction factor accelerates and the Market Stability Reserve continues absorbing surplus allowances.
For participants seeking precise execution in this environment, our programmable exchange for EU carbon allowances provides real-time price monitoring and configurable alerts so that you can act on price movements the moment they occur, rather than reacting after the fact.
ETS 2: A Second System for Transport and Buildings
From 2027, the European Union will launch an entirely new emissions trading system, known as ETS 2, covering fuel distribution for road transport, buildings, and additional industrial sectors not currently included in the original ETS. This system will operate in parallel with, and independently from, ETS 1.
ETS 2 differs from the original system in several important ways. There will be no free allocation; all allowances will be auctioned. The system covers emissions upstream, meaning fuel suppliers (not end consumers) must surrender allowances corresponding to the fuels they release for consumption. The target is a 42% reduction in emissions from these sectors by 2030, compared to 2005 levels.
A price stability mechanism has been built into the framework: if the price of an ETS 2 allowance exceeds 45 euros during the first three years of operation, additional allowances can be released to moderate volatility. This is a critical design element, as the carbon price in this new market remains uncertain and could create significant compliance costs for fuel distributors.
Global Expansion: Carbon Markets Beyond Europe
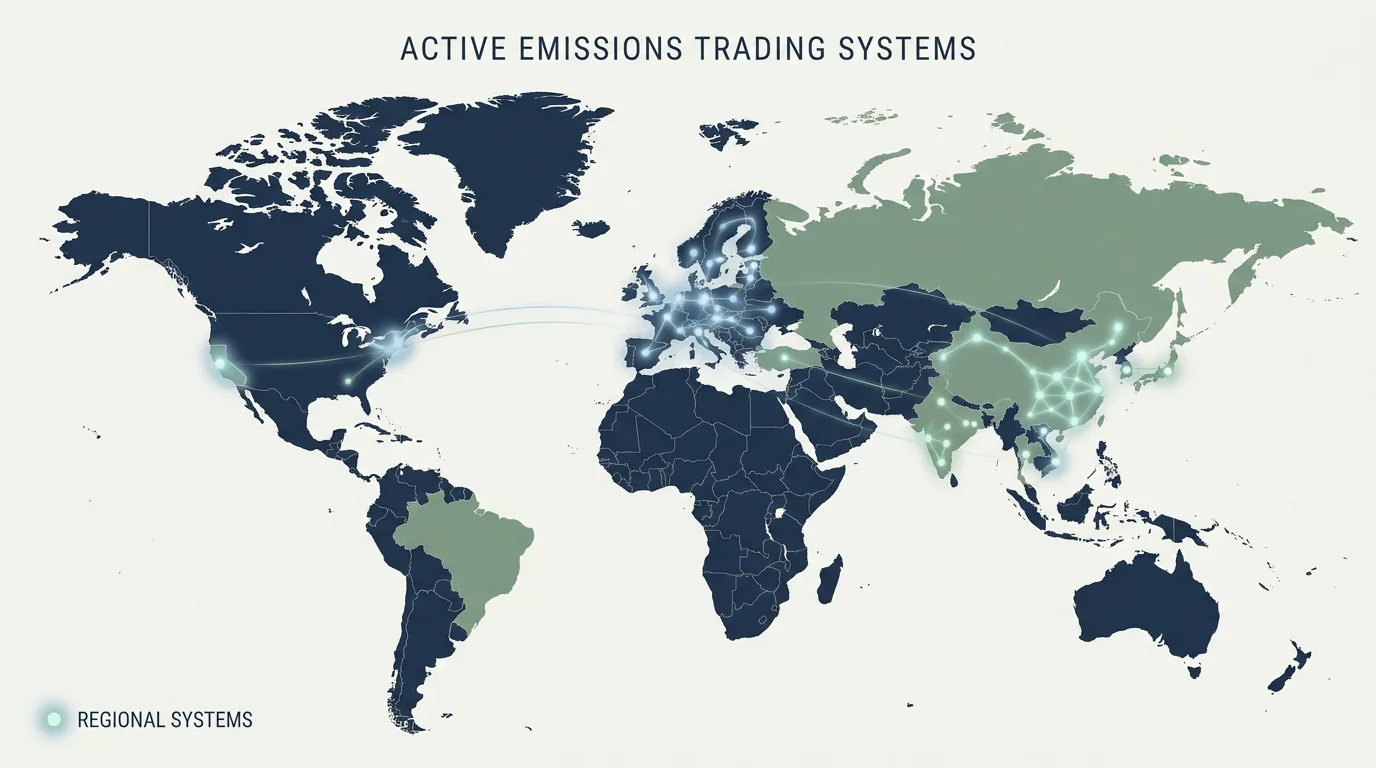
The EU ETS may be the oldest and largest, but it is no longer alone. According to the World Bank's State and Trends of Carbon Pricing 2026 report, carbon pricing now covers nearly 30% of global greenhouse gas emissions and mobilized over $107 billion for public budgets in 2025.
Emissions trading systems generated $87 billion of that $107 billion total, with carbon taxes accounting for the remaining $20 billion. The World Bank identified 87 carbon pricing instruments active globally in 2025, seven more than the previous year.
The ICAP Status Report 2026 highlights several milestones. Three new national-level systems are launching in 2026: Japan, India, and Vietnam. A key development in 2025 was the expansion of China's national emissions trading system to include the aluminum, cement, and steel sectors in March 2025. This single measure significantly increased the global share of emissions covered by carbon pricing.
An ETS is now in place in 14 of the G20 nations, and several have named it as a central instrument for NDC 3.0 delivery under the Paris Agreement. Jurisdictions operating an ETS together account for 63% of global GDP, placing carbon markets firmly at the center of the global economy.
Key Challenges Facing ETS Participants
Despite the maturation of carbon markets, participants face a set of persistent challenges that can erode returns and complicate compliance.
Price volatility. Carbon allowance prices respond to policy signals, energy market fluctuations, weather patterns, and macroeconomic conditions. The EU ETS price has ranged from under 5 EUR in its early years to peaks above 100 EUR in 2023, before settling in the mid-70s range in mid-2026. Participants without robust risk management tools face significant exposure to these swings.
Minimum trade sizes. Traditional carbon exchanges typically require standard lots of 1,000 EUAs, equivalent to 1,000 tonnes of CO₂. This minimum creates a barrier for smaller compliance entities and financial participants looking to fine-tune their positions. We designed our EUA trading platform to address this directly, enabling trades starting from just 1 EUA so that participants can calibrate their exposure precisely.
Regulatory complexity. The interaction between ETS 1, the forthcoming ETS 2, the CBAM phase-in schedule, and national carbon pricing instruments creates a layered compliance environment. Staying current requires continuous monitoring and, increasingly, automated systems that integrate with existing risk frameworks.
Market integrity and oversight. As carbon markets grow, so does the importance of preventing fraud and manipulation. The EU has strengthened market oversight rules under MiFID II, and participants must ensure that their trading venues meet the highest standards of transparency and regulatory compliance.
Strategies for Effective Carbon Market Participation
How should compliance entities and financial participants approach the carbon market in a landscape of tightening caps and rising prices? Several strategies are proving essential.
Diversified execution. Relying on a single venue or a single instrument limits flexibility. Participants who can access both spot and derivatives markets (including futures and options on EUAs) are better positioned to hedge compliance costs, lock in forward prices, and manage basis risk across time horizons.
Automation and API integration. Manual order placement is increasingly insufficient in a market that moves on policy announcements, energy price shifts, and macroeconomic data releases. Programmatic access through APIs allows participants to execute pre-defined strategies, implement pre-trade risk controls, and integrate carbon positions into broader portfolio management systems. Our API-enabled exchange infrastructure is built for exactly this purpose, offering programmable access with competitive fees and longer trading hours.
Granular position management. As noted above, traditional 1,000 EUA lot sizes can force participants into oversized positions. The ability to trade in increments as small as 1 EUA allows for more precise hedging, especially for mid-market operators whose annual compliance obligations may not align neatly with standard lot multiples.
Continuous price intelligence. With the EU ETS price projected to approach 100 EUR per tonne by the end of the decade, even small timing advantages compound into meaningful cost savings over a compliance cycle. Real-time pricing feeds and configurable alerts are no longer optional; they are fundamental infrastructure.
The Road Ahead: What to Expect Through 2030
The direction of travel for emissions trading is clear: broader coverage, tighter caps, and higher prices. In 2026, approximately 30% of global greenhouse gas emissions are covered by some form of carbon pricing mechanism. That share is expected to rise further as India, Vietnam, Japan, and other economies bring their systems fully online.
Within the EU, the cap trajectory implies zero new allowances by 2039. Researchers at the Potsdam Institute for Climate Impact Research (PIK) have noted that the functioning of an ETS approaching a final zero-supply state is largely uncharted territory, raising questions about price behavior, market liquidity, and the potential integration of carbon removal credits. The European Commission is expected to publish a report by mid-2026 examining how negative emissions could be incorporated into the trading framework.
The launch of ETS 2 in 2027 will bring fuel distributors into the compliance market for the first time, expanding the participant base significantly. Meanwhile, the CBAM will progressively eliminate free allocation, intensifying the price signal for industrial emitters in sectors such as cement, steel, and fertilizers.
For market participants, the implication is straightforward: the cost of carbon will continue to rise, and the complexity of compliance will increase. Those who invest now in flexible, transparent, and automated trading infrastructure will be best positioned to manage costs and capture opportunities as the market evolves. With emissions trading systems expanding across the globe and the EU ETS approaching its most consequential phase, the ability to execute efficiently, monitor prices in real time, and manage risk programmatically is a decisive advantage. To explore how this works in practice, request access to our demo environment and experience the difference firsthand.
Frequently Asked Questions
Who must participate in the EU Emissions Trading System?
The EU ETS covers power plants, energy-intensive industrial installations, intra-European aviation, and (as of 2026) maritime transport operators. Approximately 9,000 installations across 30 countries must hold and surrender EU Allowances equal to their verified annual emissions.
Can financial institutions trade EU Allowances?
Yes. Banks, asset managers, hedge funds, trading firms, and carbon brokers actively participate in the EU ETS as financial participants under MiFID II. Platforms such as our programmable EUA exchange at Initiativ enable these participants to trade spot and derivatives with API access, starting from as little as 1 EUA.
How is the EU ETS different from a carbon tax?
A carbon tax sets a fixed price per tonne of CO₂, while the EU ETS sets a fixed quantity (the cap) and lets the market determine the price through supply and demand. The ETS provides greater certainty on total emissions, whereas a carbon tax provides greater certainty on cost. Many jurisdictions use both instruments in parallel.


Let’s connect
Do you want more information about what we do?