


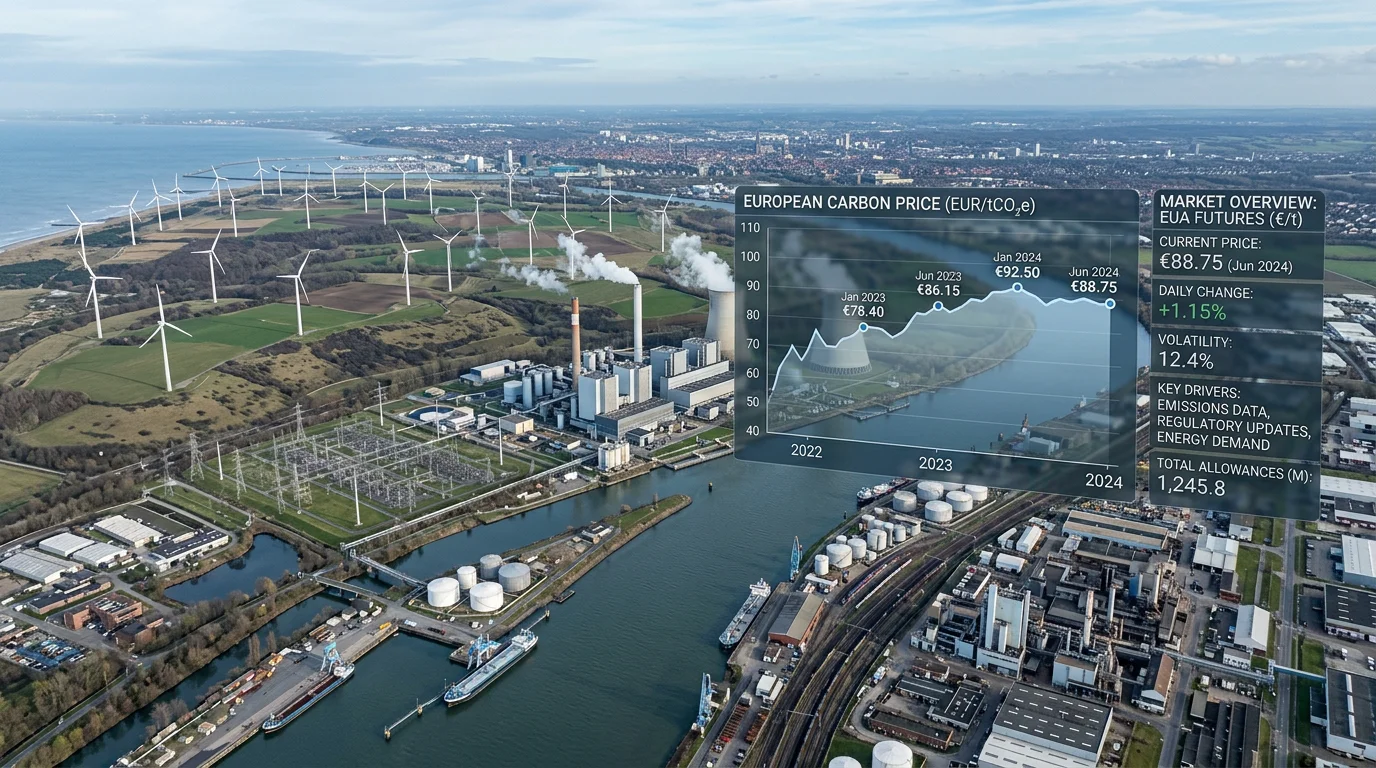

In 2025, more than 13.8 billion tonnes of CO2-equivalent changed hands in the EU allowance market alone, spread across roughly 4.4 million transactions. That volume signals how deeply carbon pricing now shapes industrial and financial decisions across Europe. To read these movements correctly, participants rely on accurate carbon market data, and understanding how prices form is a natural starting point, which is why our carbon market price discovery data matters to serious traders.
The numbers are not academic. According to an ESMA market report, on-venue trading accounted for almost 90% of secondary market activity in 2025, while over-the-counter trading receded. For compliance entities and financial participants alike, tracking these dynamics has become essential to managing exposure, timing purchases, and anticipating regulatory shifts.
What carbon market information actually measures
Carbon market intelligence is not a single figure. It is a family of indicators that describe supply, demand, price, and integrity across several distinct systems. Confusing one system with another leads to costly errors.
The core metrics fall into a few categories:
- Allowance and credit prices: the spot and derivatives value of one tonne of CO2-equivalent, whether an EU Allowance (EUA) or a voluntary credit.
- Trading volumes: the quantity of allowances or credits exchanged over a period, split between on-venue and over-the-counter activity.
- Issuances and retirements: how many credits enter the market and how many are permanently cancelled to offset emissions.
- Auction results: primary market supply, cover ratios, and revenue in compliance systems such as the EU ETS.
- Policy signals: regulatory reviews and supply mechanisms that reshape the balance between demand and available allowances.
Together, these indicators separate headline news from structural trends. Reading them in isolation rarely tells the full story.
EU ETS prices and volumes in 2026
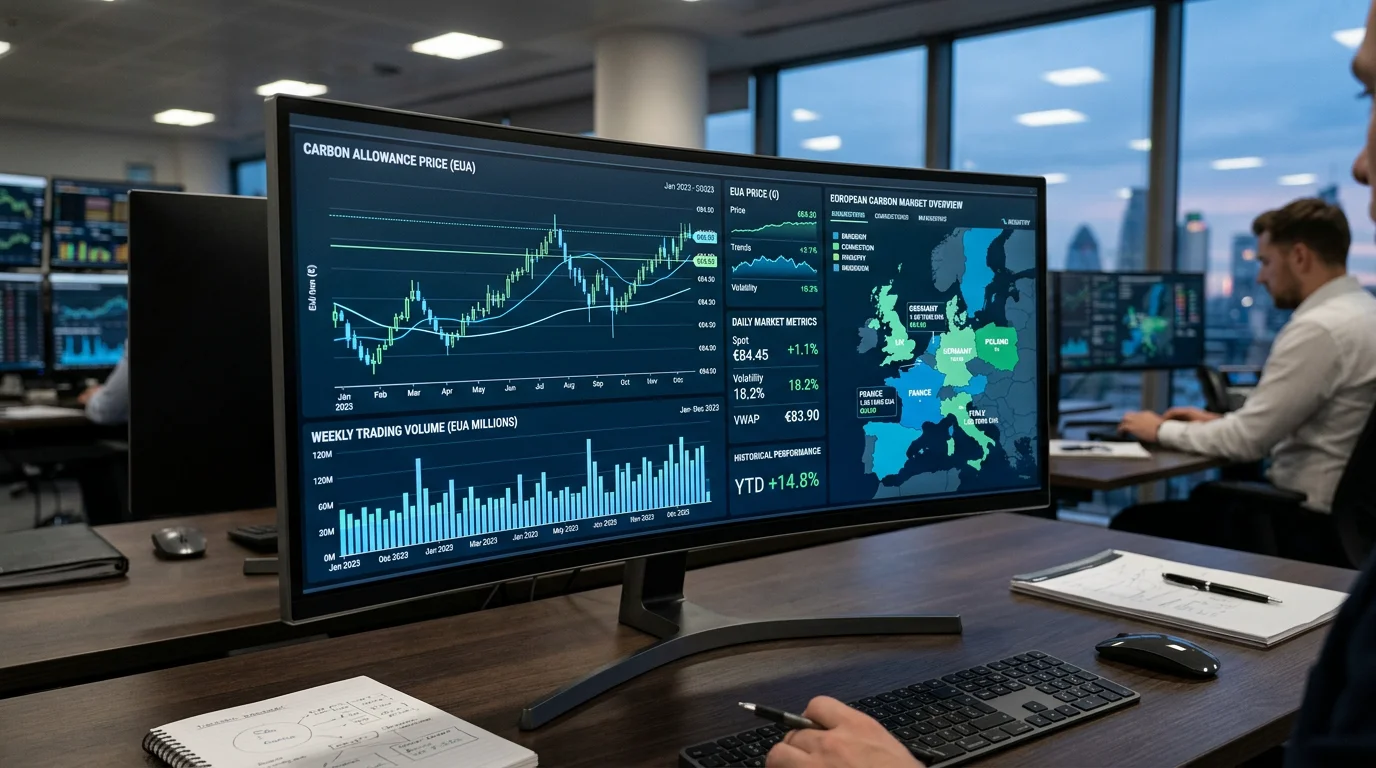
The European Union Emissions Trading System remains the reference point for compliance carbon pricing. Prices moved higher through 2026 on expectations of tighter supply. According to Trading Economics data, EU carbon permits climbed to roughly 82.67 euros per tonne in late July 2026, up about 17.71% over the preceding twelve months.
Volume tells a complementary story. EUA trading activity remained broadly stable in 2025, and auction dynamics stayed robust. The ESMA report noted that all auctions were oversubscribed, with an average cover ratio of 168% and 24 participants per auction. Despite lower auctioned volume, total auction revenues rose 11% to 43 billion euros, driven by higher prices.
These figures underline a structural point. The EU ETS is transitioning from a power-sector decarbonisation tool toward a central pillar of Europe's industrial transformation. Volatility also matters: historical volatility reached a two-year high in early 2026, ahead of the review of the EU ETS Directive and amid rising energy prices. For anyone building a trading strategy, understanding the EU ETS liquidity trends and what drives them is as important as watching the headline price.
Compliance versus voluntary markets
Why do two credits, both representing one tonne of CO2, trade at radically different prices? The answer lies in the divide between compliance and voluntary systems.
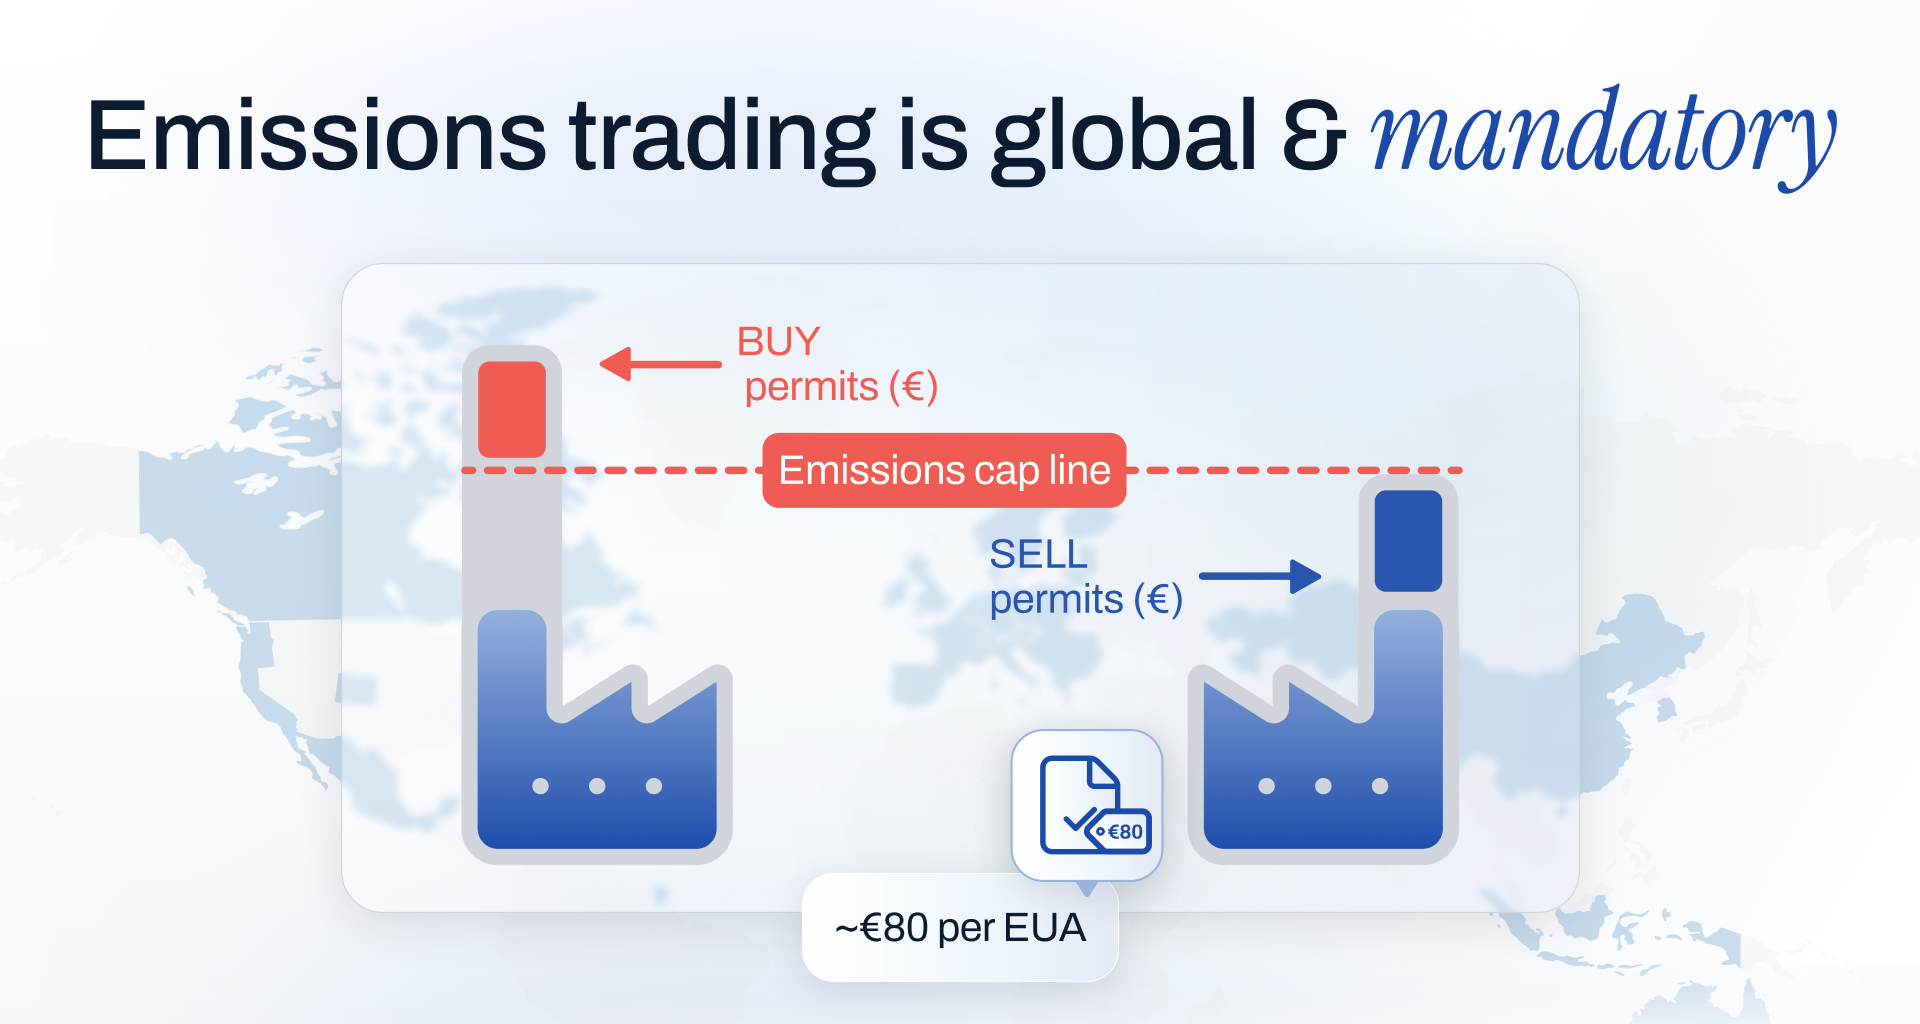
Compliance markets operate under legally binding caps. The EU ETS sits at the top of this category and commands the highest prices among large systems. According to the 2026 State of the EU ETS Report, EU allowances averaged approximately 85 dollars per tonne in 2025, well above comparable systems in China, California, Korea, and New Zealand.
Voluntary markets, by contrast, show enormous price dispersion. Values depend on project type, vintage, and certification quality. Low-quality legacy credits can trade for as little as a fraction of a dollar per tonne, while higher-integrity credits command significantly more. The gap reflects a market in transition, one increasingly shaped by credit quality, compliance eligibility, and policy signals such as CORSIA and Article 6 pathways.
The two segments are also converging. Corporate reporting frameworks and stricter integrity standards are pushing voluntary demand toward higher-quality removals. Reading both markets requires distinct datasets, yet the strategic questions they raise increasingly overlap.
Why price discovery and liquidity define data quality
A price is only as useful as the process that produces it. In carbon markets, price discovery and liquidity determine whether a quoted figure reflects genuine supply and demand or a thin, unreliable print.
On-venue trading dominates the EU ETS precisely because centralised order books concentrate liquidity and produce transparent, continuous pricing. When almost 90% of secondary activity happens on venue, the resulting reference prices carry real weight. Fragmented or opaque venues, by contrast, generate figures that mislead more than they inform.
This is where execution infrastructure becomes decisive. Smaller trade sizes, real-time pricing, and configurable alerts allow participants to act on live signals rather than stale quotes. For traders and compliance teams seeking a granular view, the ETS trading price trends for 2026 illustrate how transparent execution improves the quality of the data participants ultimately rely upon.

Comparing the main carbon market data segments
The table below sets out how the principal segments differ on price, structure, and data reliability, and where an execution-focused platform fits.
| Segment | Typical price (recent) | Structure | Data transparency |
|---|---|---|---|
| EU ETS (compliance) | ~82 euros/tonne in mid-2026 | Capped, auctioned, on-venue dominant | High, continuous |
| Other compliance systems | Below EU levels in 2025 | Regional caps | Variable |
| Voluntary market | Wide range by quality | Project-based, fragmented | Improving but uneven |
| Trading with our platform | Live EUA pricing from 1 EUA | Programmable exchange, spot and derivatives | Transparent live pricing |
Our design lowers the barrier to entry. Where traditional exchanges typically require standard lots of 1,000 EUAs, we allow trading from a single EUA, equivalent to one tonne of CO2, with real-time price monitoring and pre-trade risk controls built in.
Turning carbon market figures into decisions
Data without a decision framework is noise. The value of carbon information lies in how participants translate it into hedging, compliance planning, and investment timing.
A few practices consistently separate disciplined participants from reactive ones:
- Anchor every figure to its year. A 2025 average price is a useful benchmark, not a current quote. Always confirm the reference period.
- Distinguish primary from secondary data. Auction results reflect supply; secondary prices reflect trading sentiment. Both matter, for different reasons.
- Watch policy calendars. The EU ETS Directive review and related reforms in 2026 are actively reshaping supply expectations and volatility.
- Prioritise liquidity. A transparent, liquid venue produces prices you can trust and execute against.
For compliance entities managing recurring obligations, and for financial participants seeking exposure, the combination of live pricing and automated alerts turns raw figures into timely action. That is where reliable infrastructure earns its keep.
Reading the market with confidence
The value of carbon market data is no longer in doubt. With EU allowance volumes measured in billions of tonnes and prices near record levels in 2026, accurate figures underpin every serious compliance and investment decision. The practical challenge is not access to numbers but interpretation: distinguishing compliance from voluntary segments, anchoring each figure to its year, and prioritising liquid, transparent venues. Participants who build these habits will read the market with far greater confidence than those chasing headlines. As policy reviews continue to reshape supply, disciplined analysis remains your most durable advantage.
Take action with Initiativ
Understanding the market is the first step; acting on it quickly and precisely is the next. Whether you manage compliance obligations under the EU ETS or seek professional exposure to carbon allowances, you need execution that matches the quality of your analysis. We built our platform for exactly that purpose, giving you live pricing and the tools to respond as the market moves.
We serve traders and corporates with a programmable exchange for EU Allowances in spot and derivatives form. You can trade from a single EUA rather than traditional 1,000 EUA lots, monitor real-time prices, configure alerts, and apply pre-trade risk controls, with cash protected and guaranteed up to 100,000 euros by the FGDR. Request access to our demo environment to see it in practice.
Frequently Asked Questions
What is included in carbon market information?
It covers allowance and credit prices, trading volumes, issuances, retirements, auction results, and policy signals. These indicators span both compliance systems, such as the EU ETS, and voluntary markets. Reading them together reveals structural trends rather than isolated headlines.
How much did EU carbon permits cost in 2026?
EU carbon permits traded around 82.67 euros per tonne in late July 2026, up roughly 17.71% over the preceding twelve months. Prices rose largely on expectations of tighter supply. Figures shift daily, so always confirm the current quote before acting.
Why do compliance and voluntary credits differ so much in price?
Compliance credits operate under legally binding caps, which supports higher and more stable prices. Voluntary credits vary widely by project type, vintage, and certification quality. As a result, two credits representing one tonne of CO2 can trade at vastly different values.
Where does reliable carbon pricing come from?
Reliable pricing comes from liquid, transparent venues where trading concentrates in centralised order books. In the EU ETS, on-venue activity accounted for almost 90% of secondary trading in 2025. Our platform delivers transparent live pricing so you can execute against figures you trust.
How often should carbon figures be updated?
Prices and volumes move continuously, so intraday monitoring is advisable for active participants. Structural datasets on issuances and retirements are often updated monthly. Always tag each figure with its reference year to avoid treating dated numbers as current.
This may interest you


Let’s connect
Do you want more information about what we do?